Eavesdropping sounds like such an unacceptable thing to do. But that is exactly what researchers are doing to learn more about the living world. To be clear, we are not talking about listening to human conversations but rather to birds, frogs, insects, bats, whales and any other species that makes a sound. This is nature’s orchestra, known as “biophony.”
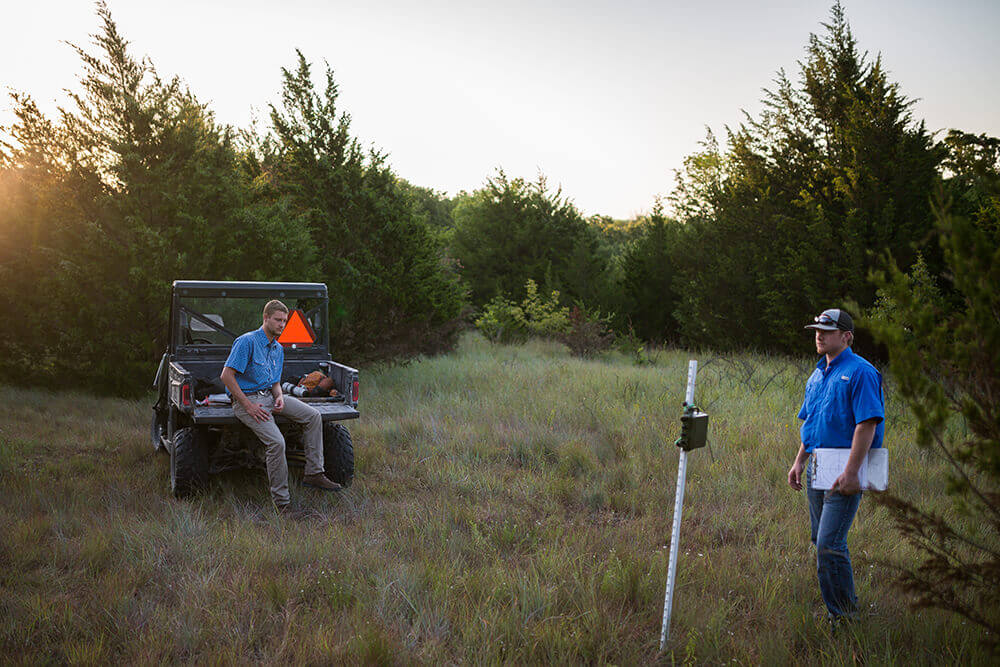
Researchers use acoustics to study living things by deploying bioacoustic monitors. These monitors also are referred to as passive acoustic monitors (PAM) or autonomous recording units (ARU) (see the small, green PAM mounted on the white post in Figure 1).
If it chirps, squawks, crows, howls, whistles, peeps, croaks, gurgles or belches, then the PAM can capture the sound, which is stored on a memory card and then analyzed using image recognition software. Yes,sounds are analyzed as images.
PAMs have many uses and applications, but one of the primary goals for ecologists is being able to collect and analyze data at large spatial scales to monitor status, trends, distribution and habitat use of wildlife species — all of which are important targets of management or indicators of successful management.
How Acoustic Monitors Work
Think of PAMs like game or trail cameras. Game cameras are set out to collect pictures of many different wildlife species to estimate presence, population size or habitat use. PAMs can generate these same types of survey data. Cameras are better at capturing larger, moving objects, whereas the PAMs can capture any sound but are better for more vocal species like birds, bats and frogs.
The current PAMs on the market (see sidebar) are easily programmable, like cameras, and offer much flexibility to meet specific survey needs. For example, PAMs can be scheduled to turn on multiple times per day and for varying lengths of time and can collect hundreds of hours of audio.
If it chirps, squawks, crows, howls, whistles, peeps, croaks, gurgles or belches, then the PAM can capture the sound.
Most PAMs will be manufactured to record across two frequency ranges. The first is the ultrasonic range in which the echolocation calls of bats can be recorded. The second range can typically capture very low frequency calls, such as whales, and mid-frequency calls that will record most insect, bird, frog and animal sounds. Just like adjusting picture quality, users of PAMs can adjust the sampling rate and the type of output audio file (.wav or .w4v).
How Species Identification Works
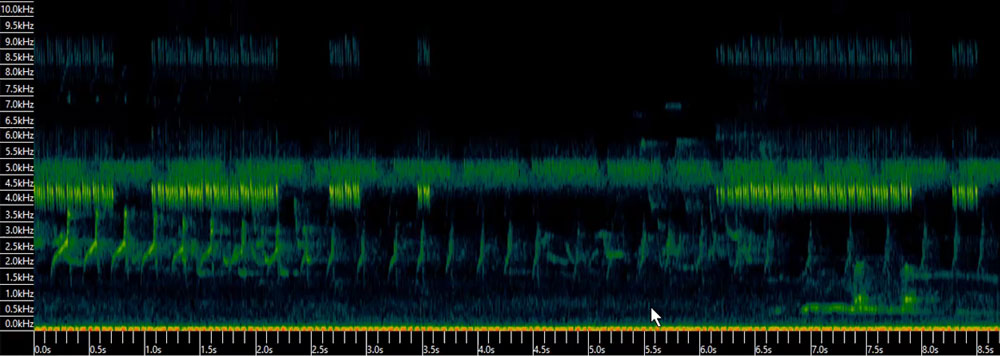
At the end of the day, when users start to analyze data from PAMs, the process ends up being similar to camera images. The audio files are converted to a spectrogram, which is a visual representation of the spectrum of frequencies of a signal as it varies with time. Spectrograms may also be referred to as sonograms or spectrographs. An image, or spectrogram, is shown in Figure 2, depicting many different species identified on one PAM during a short window of time (less than 10 seconds).
PAMs are great. They collect a lot of data. However, this brings up a new problem. How do you sort, process and identify all of the species in the data? After converting the audio files to spectrograms, there are various commercial software programs available to help sort and identify calls.
Commercial packages go beyond playback and viewing of spectrograms by providing methods for detection, measurement and other analyses. Kaleidoscope by Wildlife Acoustics uses cluster analysis to do detection, while Raven by the Cornell Lab of Ornithology uses energy detection (see sidebar).
There also are custom programs written in R or Python that use artificial intelligence techniques known as deep learning to identify the species, but this process is generally restricted to savvy computer programmers (see sidebar).
Resources for Bird Sounds
- Merlin® (www.merlin.allaboutbirds.org) is a phone app developed by the Cornell Lab of Ornithology (www.birds.cornell.edu/home/). Merlin draws on data from All About Birds (www.allaboutbirds.org/news/) and has the ability to filter species by location and time of year.
- BirdNET (www.birdnet.cornell.edu) allows users to record a call with their phone. After the call is recorded, the app displays a spectrogram of the call.Then, using machine learning, it identifies the species and provides links to multiple resources for that species.
- Macauley Library (www.macaulaylibrary.org), also available through the Cornell Lab of Ornithology, is a media archive for wildlife, including maps, statistics, photographs and sounds.
- Xeno-canto (www.xeno-canto.org) is a curated repository of bird calls and images from all over the world.
Resources for Acoustic Monitors
- Wildlife Acoustics (www.wildlifeacoustics.com) produce several types of monitors, including some that record higher frequencies for detecting bats. They also produce a device (Echo Meter Touch 2) that turns a smartphone into an interactive bat detector.
- SWIFT (www.birds.cornell.edu/ccb/swift/) is a terrestrial passive acoustic recording unit produced by the Cornell Lab of Ornithology.
- Audiomoth (www.openacousticdevices.info) is a unit developed by Open Acoustic Devices. The unit is a full-spectrum acoustic logger than can detect a wide range of frequencies. However, users must devise a method of housing the logger for protection.
- Frontier Labs (frontierlabs.com.au) produce advanced bioacoustic audio recorders (BAR) that are versatile with a built-in GPS.
Analysis Software
- Kaleidoscope (www.wildlifeacoustics.com/products/kaleidoscope) is a software produced by Wildlife Acoustics. There is a free version (Lite) and a professional version (Pro) that aid in sound analysis for identifying species.
- Raven (ravensoundsoftware.com/software/) was developed by the Cornell Lab of Ornithology. Raven Lite is a free version, but for full capabilities, Raven Pro offers more flexibility and analysis.
- R (www.r-project.org/) packages are available for analyzing acoustic data, but these require more programming and coding experience. Packages include: warbleR, Rraven, monitoR, and soundecology.
- Python also has libraries available for image analysis: OpenCV, Numpy, and scikit-image.
- Other options that allow viewing and playback of spectrograms from recordings include Audacity and WavePad.
Each program and method has advantages and drawbacks, and their utility depends upon the user’s intended application. With commercial software, it can be difficult to efficiently analyze all of the data because of the sheer volume of data (gigabytes to terabytes) and such a large number of sounds in each recording. However, because of the increased focus on large-scale, biodiversity monitoring, great headway is being made at improving efficient and accurate identification of species.
Example: Northern Bobwhite Quail
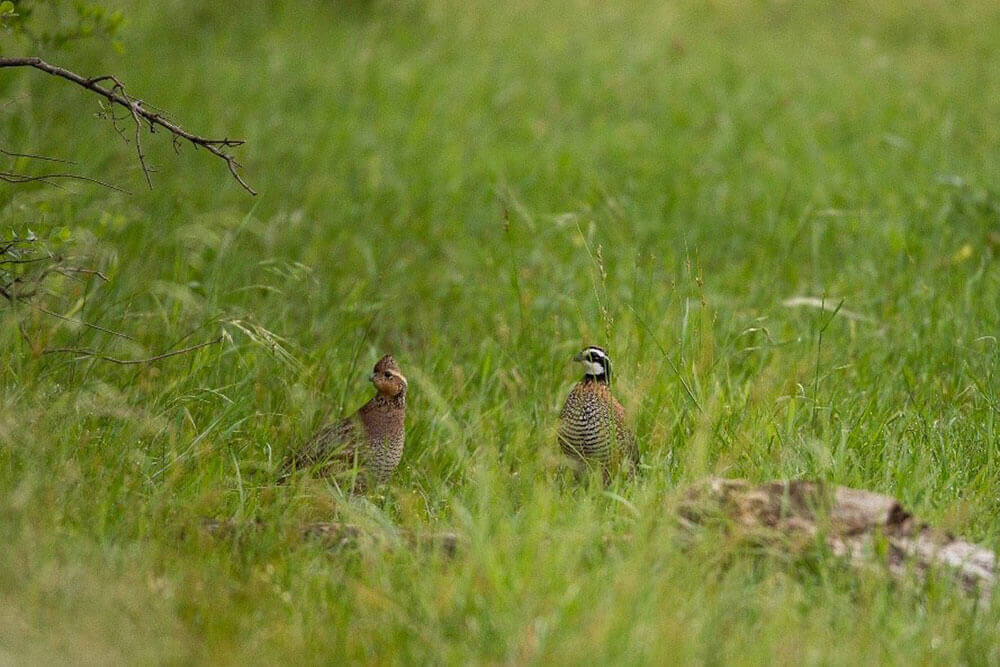
Populations of northern bobwhite quail (Figure 3) have been declining across their range, with declines ranging from 68-75% in Oklahoma and Texas during the past five decades.
From 2008 to 2018, Noble Research Institute conducted spring whistle counts for bobwhite to look at trends in populations as they relate to environmental and habitat conditions. Starting in 2019, PAMs replaced traditional human surveys, allowing researchers to monitor 29 sites simultaneously across two study sites. PAMs collected data for three days during four separate sessions (12 days total) during the spring of 2019 and 2020, which coincides with the calling activity of many species of birds.
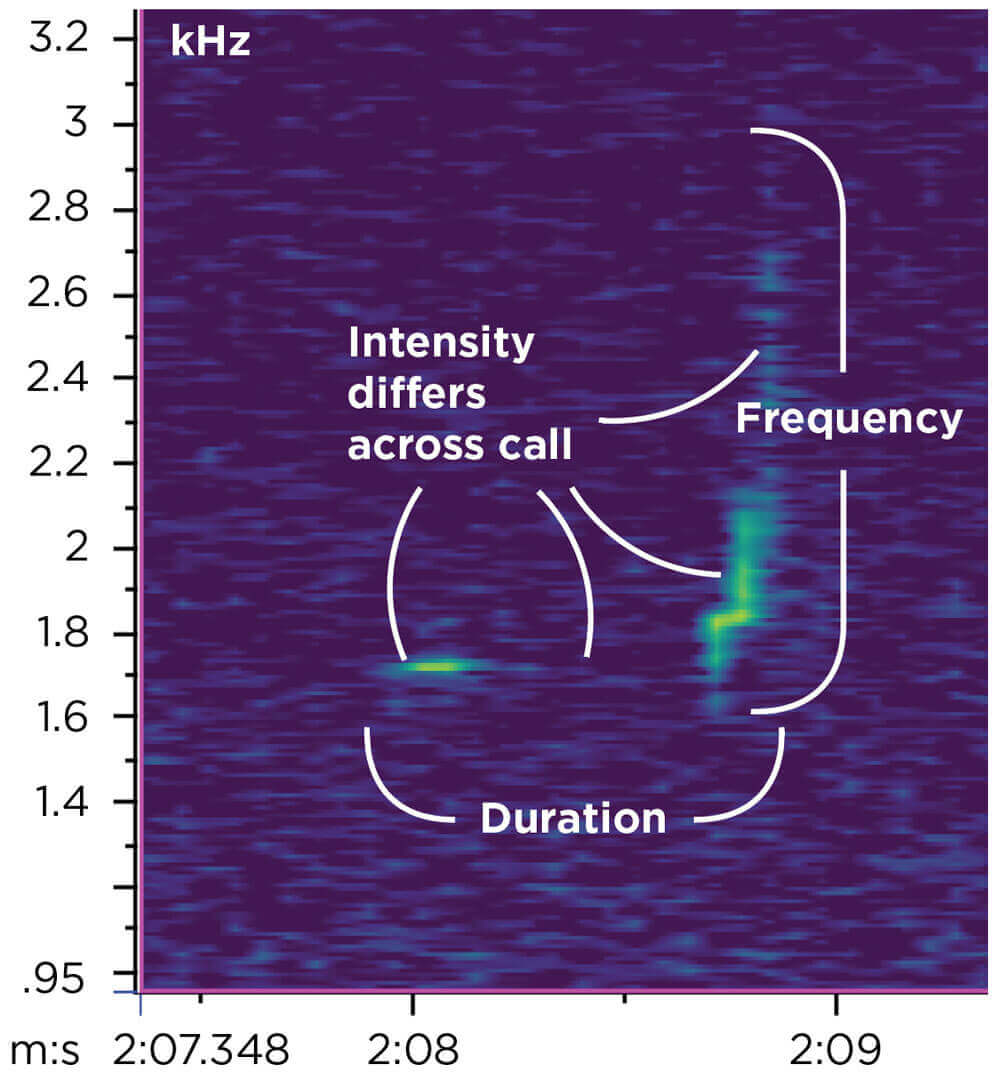
Because bobwhite were a primary target for monitoring status and long-term trends in population size, distribution and habitat use, researchers developed their own recognition software that efficiently identifies and records all bobwhite calls from hundreds of hours of recordings. When the male bobwhite call is converted from audio to a spectrogram, it creates a very unique signature (Figure 4), which looks a little like a checkmark.
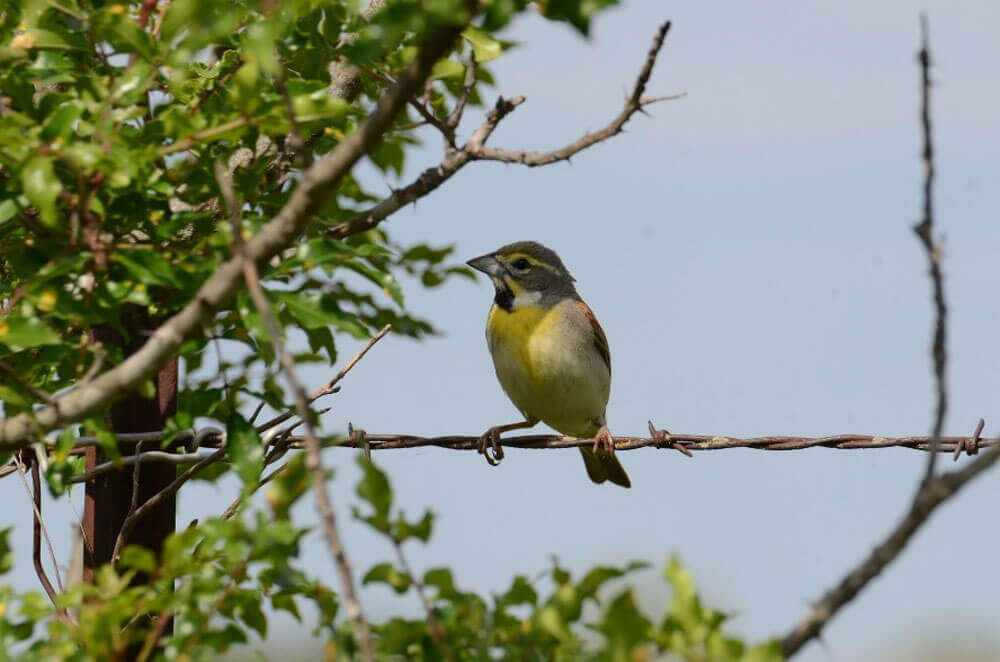
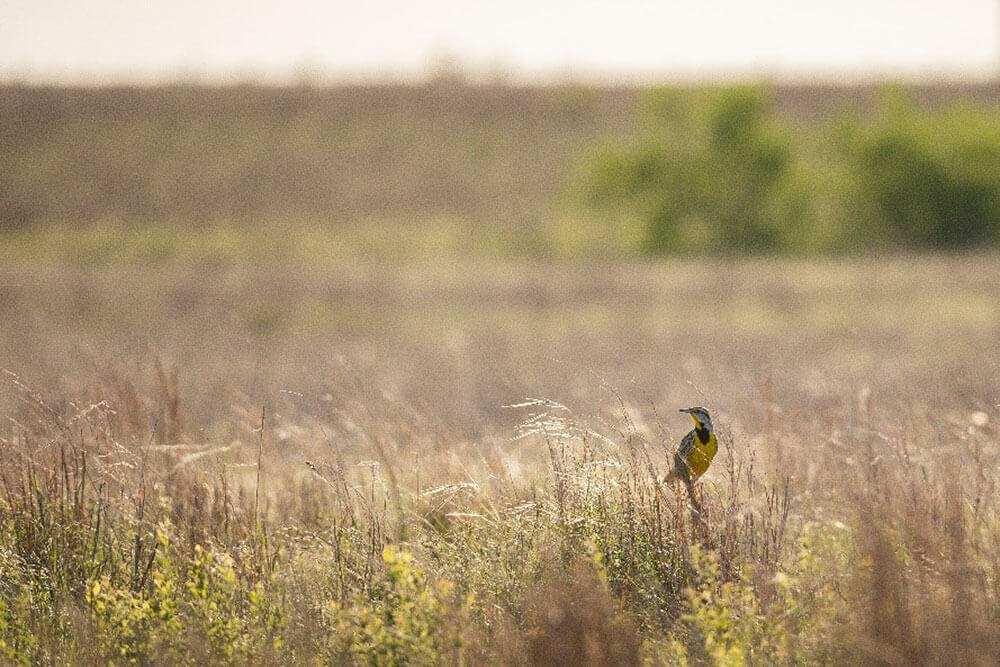
The PAMs now offer a permanent record of all recorded species that are important for understanding biodiversity, changes in populations and habitat use. Current research is developing acoustic matching templates for other species of conservation concern, or that are considered game, indicator or umbrella species. For example, dickcissels (Figure 5) and eastern meadowlarks (Figure 6) also have been experiencing long-term declines in their populations, so managers may want to keep a close eye on whether these species are present and in what numbers if present.
Uses and Applications
There are many uses and applications of PAMs for research, management and the casual birding enthusiast. As mentioned earlier, many species of grassland birds are experiencing range-wide declines so having a tool that can be deployed across large areas is crucial to documenting and understanding the causes for the decline. Many times, this is linked to the loss of habitat or even degradation of potential habitat. Researchers can use the data from PAMs to estimate population size, distribution and habitat use, which are critical pieces of information required for managing any species.
Managers or biologists can use the information about whether or not a species is present to help determine the current condition of the landscape. These species are known as indicator species, and their absence usually is the first indication that something is broken or missing in the system.
The number and particular species of birds (or even frogs or insects) that show up in the PAM data gives insight into the larger community of plants, animals and soil, which ultimately contributes to ecosystem health and functioning. Biodiversity, or the number of species present, is often used as an indicator of ecosystem health, which then can provide many ecosystem services (e.g., pollination, insect/pest control).
Conclusion
Everything on the landscape is changing, although we may not be able to see it until years down the road.
Change may occur naturally because of weather, climate or succession, but the most predominant source of change is associated with humans. Land conversion and development or implementation of management practices (e.g., prescribed fire, brush control) are sources of human-caused change.
The most important aspect of change is that change doesn’t affect just one species; it can affect an entire population, community or ecosystem. For example, removing fire from a landscape sets off a cascade of changes to the plant, animal and invertebrate communities. Another example is grazing by large herbivores, which impacts the ecosystem, but usually in a positive way when integrated properly.
Bringing this full circle, we can tell a lot about the health of the land and plant community by knowing what bird species are present.

Mike Proctor
Mike Proctor, former Noble Sr. Research Associate
Stephen Webb, Ph.D.
Stephen Webb, Ph.D., former Noble Sr. Research Consultant
Comment