Vegetation monitoring is of great importance to land managers. But it’s difficult to accomplish. It’s tedious and time-consuming, requiring personnel trained in ecology and range plant identification. Once the data is collected, it has to be entered into a database, processed further to obtain estimates of biomass or quality, then analyzed. Most often, vegetation data is collected for limited seasons or years, so you only gain an understanding into the current conditions, and nothing about what direction things are headed. Knowing something about the past can provide a great deal of insight into what may happen into the future, but that can only be done if the data exists.
This is where the Rangeland Analysis Platform (RAP) comes into play as a useful tool for everything from monitoring how drought has affected perennial forage on a ranch to evaluating how well prescribed burns are working over time to reduce tree cover.
More Than Three Decades of Vegetation Data
The RAP dataset consists of images where vegetation cover is estimated over an area of about onefourth
of an acre. RAP data extends back to 1984; the most current year is 2019, with plans to add a new set each year. The dataset uses Landsat satellite imagery, various vegetation indices, weather, topography and soils to estimate vegetation cover. To provide greater accuracy of cover estimates, 30,000 sampling locations are monitored for on-the-ground data. The program uses advanced analytical tools known as machine learning to develop predictions for estimating cover of grasses, forbs (grasses and forbs are combined into what is called a “herbaceous” cover type), shrubs, trees and bare ground. Currently, the data only covers the western half of the U.S.
About the RAP tool
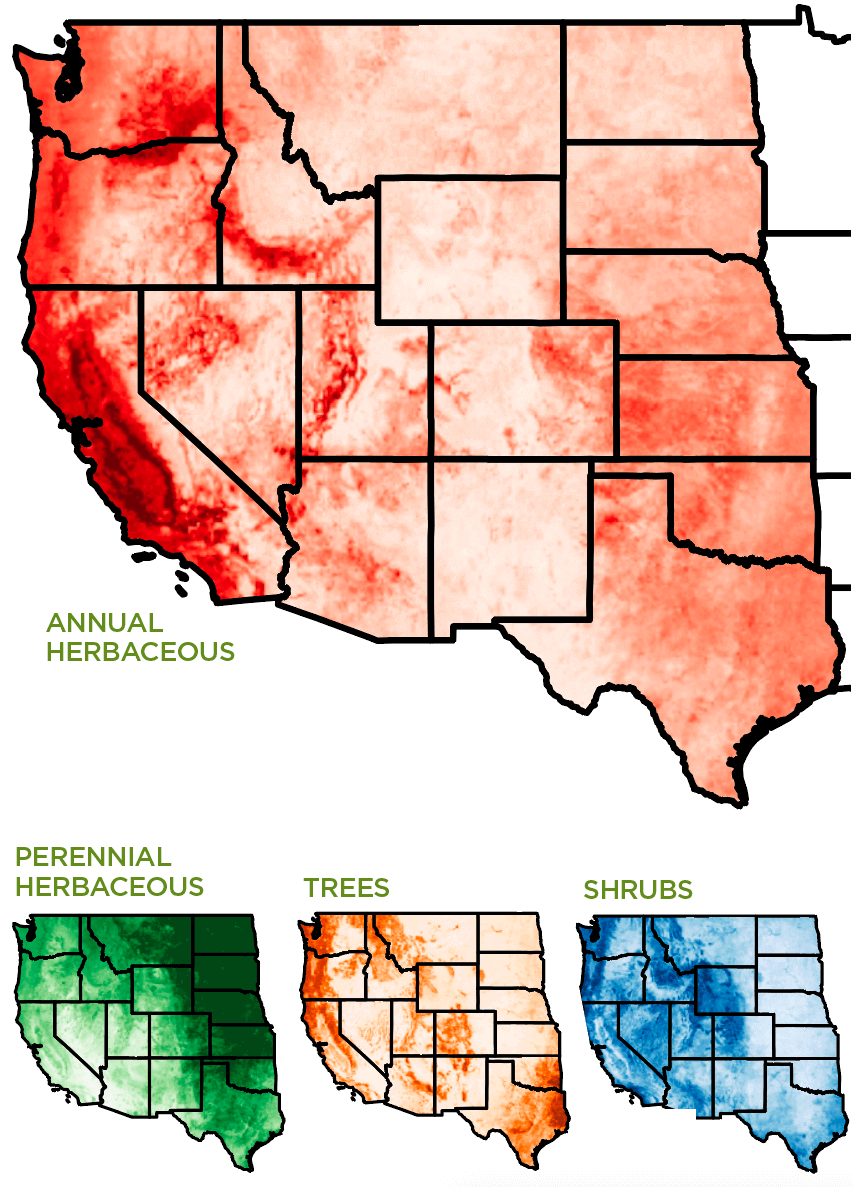
RAP is a free, interactive online mapping tool (https://rangelands.app) that allows managers to track annual changes in vegetation cover. RAP lets managers, landowners or conservationists visualize and estimate the percentage cover of annual grasses and forbs, perennial grasses and forbs, shrubs, trees, and bare ground.
Using RAP
On the RAP homepage, you’ll see a fact sheet, video demonstration and user guide to help you get started, or, since RAP is interactive, we recommend that you just navigate around the application and learn what each feature can do.
Click the “LAUNCH APP” button to take you to the application. From there, you can zoom into an area of interest ( AOI). Adjusting the “Opacity” in the box to the left will make navigation to an AOI easier. Land cover type and year can be changed from the menu in the top left. Where RAP really shines is by creating “times series” data sets to view.
Using RAP to view a specific area is fairly straightforward if you are already familiar with shapefiles (polygon boundaries of an AOI). If not, don’t be intimidated. Simply click the “Draw features” button to draw a box or polygon around the AOI. You can draw a simple box or try to map the exact boundaries of a property. To map the property, you will need to click on the area more often to smooth the AOI boundaries to conform to the property boundary. If you have a shapefile of your AOI, simply click on the “Upload shapefile” button and browse to the file.
There are also several land cover types from which to choose. For example, choosing a cover like tree cover and clicking on the right triangle will let you see changes in tree cover from 1984 to present. Now that you are familiar with this visualization, known as a time series, click on the “Calculate time series” button. After the program does an analysis, a small graph will appear in the lower left of your screen. The graph is too small for interpretation, so click on “Generate report,” which will create a PDF containing the graph and AOI. For more advanced users, or to create your own figures, click on the “csv” or “Excel” buttons on the left of the thumbnail figure to export the raw data.
There can be a lot of variability in cover of each vegetation type from year to year (see “Predicted Cover for RAP Classes” figure). Some of the real value comes from the data spanning the past 35 years, so that is a powerful way to look at trends in cover changes over time. Advanced users can export the raw data to Excel as we mentioned previously and then create a figure within Excel. After that, add a trendline to see whether a land cover type is increasing or decreasing over time. See the Marshall County, Oklahoma, case study for an example of what type of information can be extracted from the raw data.
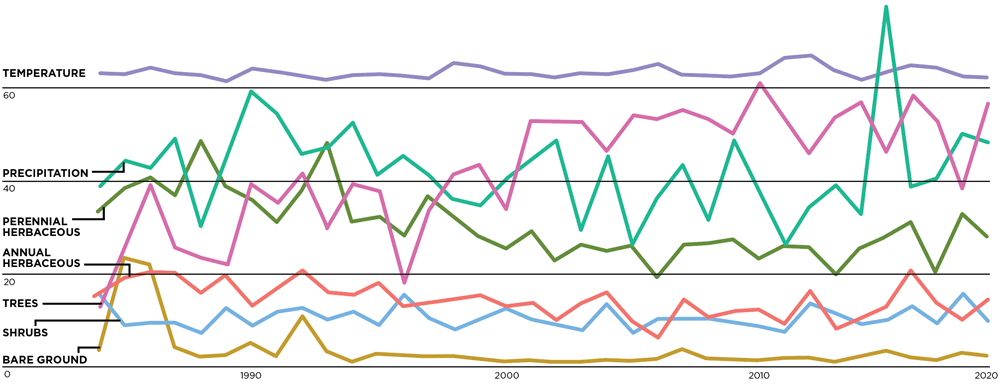
Change in vegetation cover classes Now, let’s look at the vegetation cover classes. Annual herbaceous vegetation declines slightly, from 19% cover to 15%, over the 35-year period. The amount of bare ground also decreases, which is good news because the soil is staying covered with vegetation, one of the soil health principles. Perennial herbaceous vegetation shows a drastic decline, from 40% down to 20% over time.
Next, let’s look at tree cover. Tree cover increases from 27% all the way up to 60%, as we predicted would happen based on principles of succession (changes in vegetation communities). If there’s such a noticeable increase in trees, then why aren’t there any changes in shrub cover? The increase in the tree cover has come at the expense of the first three classes, but shrubs seem unaffected. The loss of herbaceous cover changes the wildlife forage and habitat potential and the amount of grazeable acres for cattle, but not for the better.
Now back to our question about why shrub cover hasn’t changed. The shrubs overtake bare ground and herbaceous cover during succession, but then this woody community matures into what is then classified as tree cover. The amount of area covered by shrubs remains relatively constant over time, but the area covered in trees increases steadily. Once a vegetation community reaches its final seral state, the tree class, there is nowhere else to go, unless a woody plant control management practice is implemented, like prescribed fire or chemical or mechanical brush control.
Predicted Cover For Rap Classes
Real-life RAP Example: Marshall County, Oklahoma
We downloaded RAP data for an area in southern Marshall County, Oklahoma, comprising about 130 acres. We knew the land-use history of this location, so we were interested in how RAP predicted vegetation cover changes over time. Most of the area had been disked just a few years prior to the start of the platform. Since that initial disking, no further land management or modification has occurred. As ecologists, we predicted that we would see a strong increase in woody plants (shrubs and trees).
The graph produced by RAP is pretty busy, with seven lines for the vegetation types along with temperature and precipitation. Again, notice the annual variability of each cover class (the peaks and valleys in the lines). This is partially driven by weather patterns. There are trends in the data even if they are difficult to see.
Temperature is averaged over an entire year. The change in average annual temperature over the whole time period isn’t dramatic (less than 1 degree Fahrenheit increase), but considering these are average annual temperatures, there is a lot of variability over years. This is something we are all too familiar with, living in Oklahoma and Texas. The same holds for precipitation: the trend line shows average precipitation of approximately 40 to 42 inches per year. Just like temperature, there are variable patterns of precipitation, with some years showing above-annual precipitation along with years of well-below-average rainfall.
Useful Tool for Land Managers
The Rangeland Analysis Platform can be a useful tool, not only in the Western U.S., but also in the Great Plains. It can help managers involved in land stewardship and range ecology better mitigate climate and land use change by managing and building resilient rangelands.
Mike Proctor
Mike Proctor, former Noble Sr. Research Associate

Stephen Webb, Ph.D.
Stephen Webb, Ph.D., former Noble Sr. Research Consultant

Comment