Category: Regenerative Agriculture
Categories
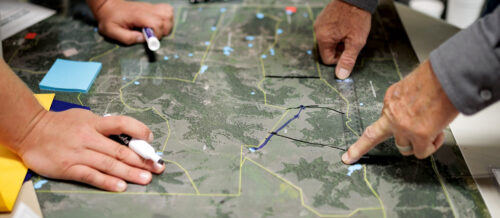
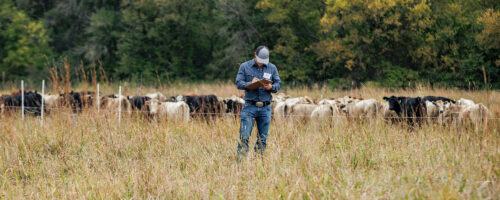
Why You Need a Grazing Plan and How to Start One
Estimated reading time: 3 minutes
Taking time to make and follow a grazing management plan pays many dividends.
Improving versus Maintaining
Estimated reading time: 4 minutes
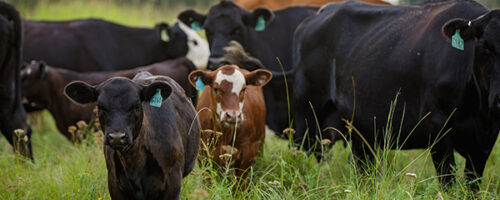
Regenerative ranching builds natural resources.
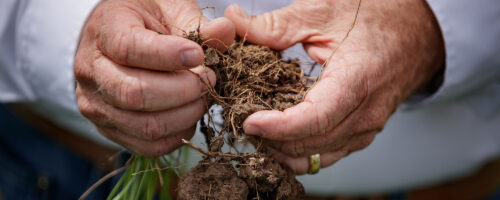
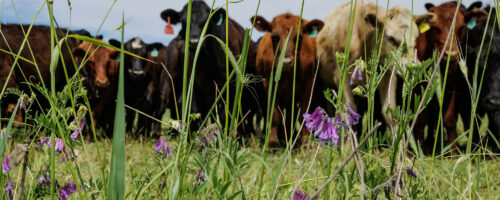
Putting Soil Health First
Estimated reading time: 3 minutes
Health below the ground is key.
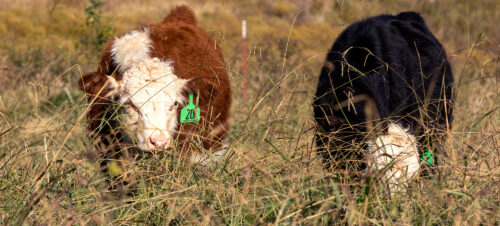
Intentional Improvement
Estimated reading time: 7 minutes
Keys to successful regenerative grazing.
Choosing Nature’s Calving Season
Estimated reading time: 9 minutes
Noble Ranches have increased cow-calf enterprise gross margins by shifting spring calving two months late...
Low-Risk Strategies to Transition from Conventional to Adaptive Grazing
Estimated reading time: 6 minutes
Starting small and using what you have are ways to ease into regenerative practices.
What Your Grass and Cover Crop Seeds Need to Succeed
Estimated reading time: 6 minutes
The health of your soil and a few core principles lead the way to good germination
Farming at a Human Scale
Estimated reading time: 4 minutes
In the heart of the Adirondack Mountains, a couple revives pastures with grazing and compost.
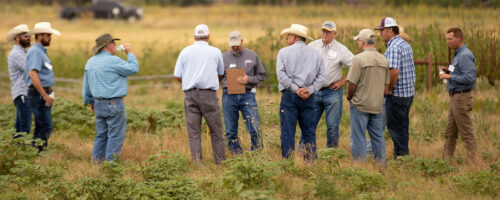
Building Your Grazing Community
Estimated reading time: 5 minutes
Find like-minded farmers and ranchers to support your regenerative grazing goals.
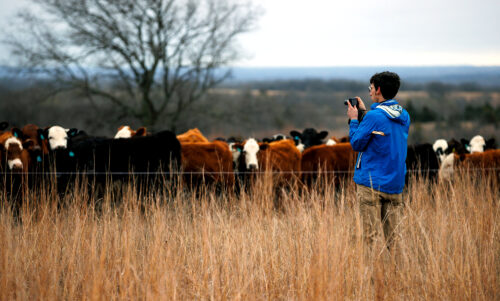
Sharing Your Ranching Story on Social Media
Estimated reading time: 6 minutes
How to build community and connections by posting stories, photos and videos of your regenerative journey
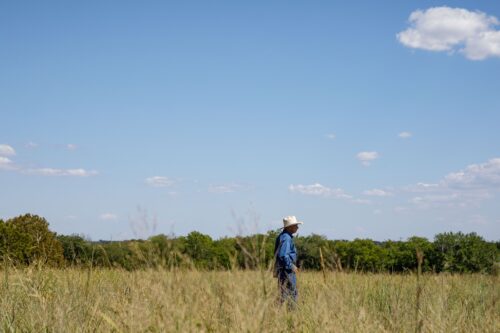
Simple ways to measure soil health improvements in real time
Estimated reading time: 6 minutes
Tap into your observational senses to mark progress anytime you’re out in your pastures.
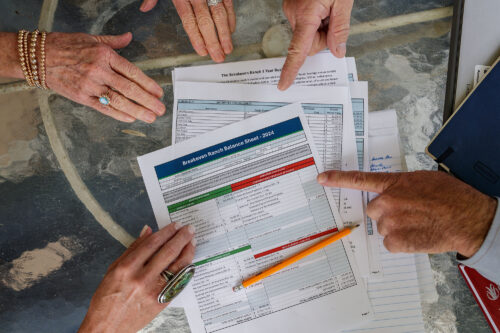
Identify new management practices for better profitability
Estimated reading time: 2 minutes
Learn how to assess costs, set profit targets and adopt regenerative practices sustainably with help from...
Compute and track your ‘reserve herd days’ to manage forage inventory and grazing
Estimated reading time: 11 minutes
Knowing how to estimate forage inventories and actively manage grazing accordingly cuts down on hay feedi...
How to extend grazing days with fall cover crops
Estimated reading time: 4 minutes
Ranching advisor Jim Johnson breaks down a common question he hears from ranchers – how to incorporate...
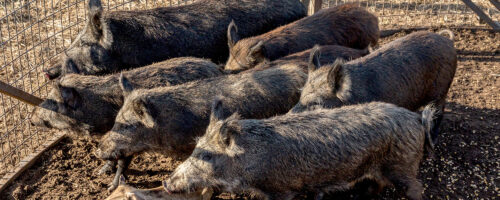
Four ways feral hogs cost farmers and ranchers
Estimated reading time: 6 minutes
Learn to recognize signs of these invaders, what’s at risk and what you can do to control their populat...
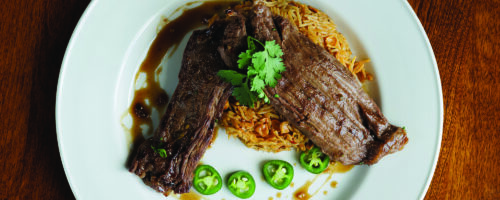
Sweet Tamarind Chili Steak
Estimated reading time: 1 minutes
Expertly crafted in the Certified Angus Beef® brand test kitchen, this recipe offers a delectable fusion...