Category: Regenerative Agriculture
Categories
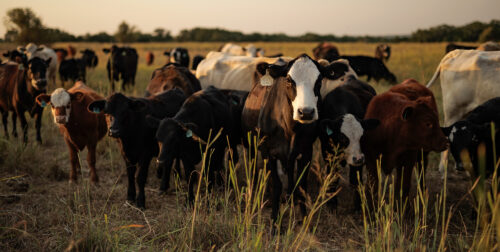
Overgrazing vs. Overstocking: Long-Term Impacts on Pastures and Profitability
Estimated reading time: 4 minutes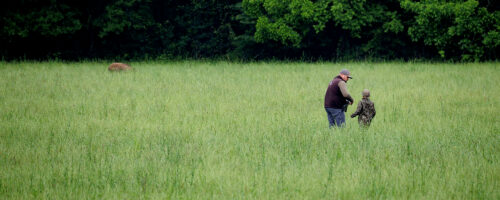
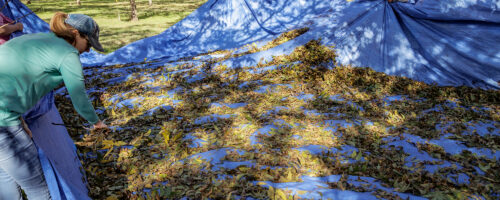
How to Turn your Whole Ranch into a Wildlife Food Plot
Estimated reading time: 6 minutes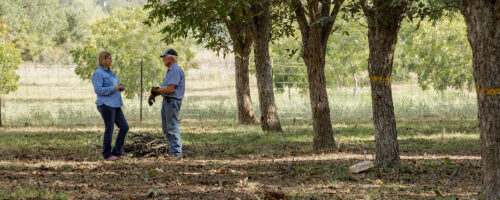
Addressing the Root Causes of Our Problems
Estimated reading time: 5 minutes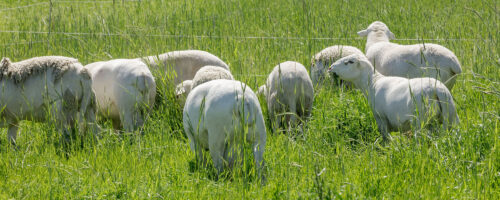
What to Know When Adding Small Ruminants to Your Cattle Operation
Estimated reading time: 5 minutes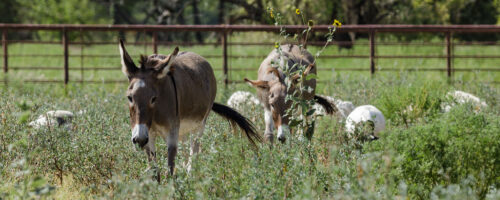
Why Ragweed Isn’t the Problem (and What Is)
Estimated reading time: 6 minutes
In a regeneratively managed pasture, weeds aren't the problem, but they are an indicator of an ecosystem...
Profit per Acre, Over Production per Acre
Estimated reading time: 4 minutes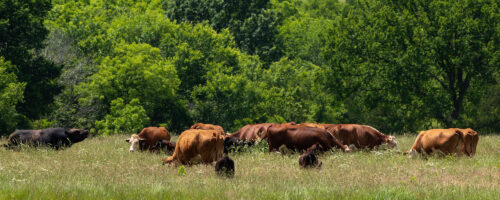
The First Step Toward Better Grazing: Understanding Rest
Estimated reading time: 5 minutes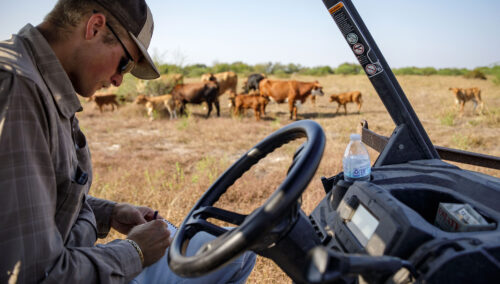
Simple Monitoring for Pasture Management
Estimated reading time: 6 minutes
Measuring progress in your regenerative journey can be fast, simple, observational and make an impact on...
Carrying Capacity Versus Stocking Rate: Getting the Numbers Right
Estimated reading time: 6 minutes
Mixing up these terms can lead to overgrazing and weak pastures, but if you get the calculations right, y...
Three low-risk practices to cut costs without sacrificing tradition
Estimated reading time: 4 minutes
Taking Regeneration Further: Advanced Practices That Pay Off Long-Term
Estimated reading time: 5 minutes
10 Simple Ways to Increase Profit on Your Ranch
Estimated reading time: 6 minutes
Rebuilding Regeneratively
Estimated reading time: 8 minutes
Push the pencil before trying to push cattle numbers.

Why You Need a Grazing Plan and How to Start One
Estimated reading time: 3 minutes
Taking time to make and follow a grazing management plan pays many dividends.
Improving versus Maintaining
Estimated reading time: 4 minutes
Regenerative ranching builds natural resources.

Putting Soil Health First
Estimated reading time: 3 minutes
Health below the ground is key.